 Tech Venture Lab
Let's turn your idea into a product people rely on
Tell us about your project. We'll reply within one business day with a clear next step, scope, and timeline.
Tell us about your project. We'll reply within one business day with a clear next step, scope, and timeline.
9 min readTech Venture Lab
Every business generates data: sales records, website visits, customer messages, inventory movements, support tickets, payments. But data on its own is just noise. The companies that grow faster are the ones that can answer questions quickly and confidently: What is selling? Where are we losing customers? Which campaign actually works? What will demand look like next month?
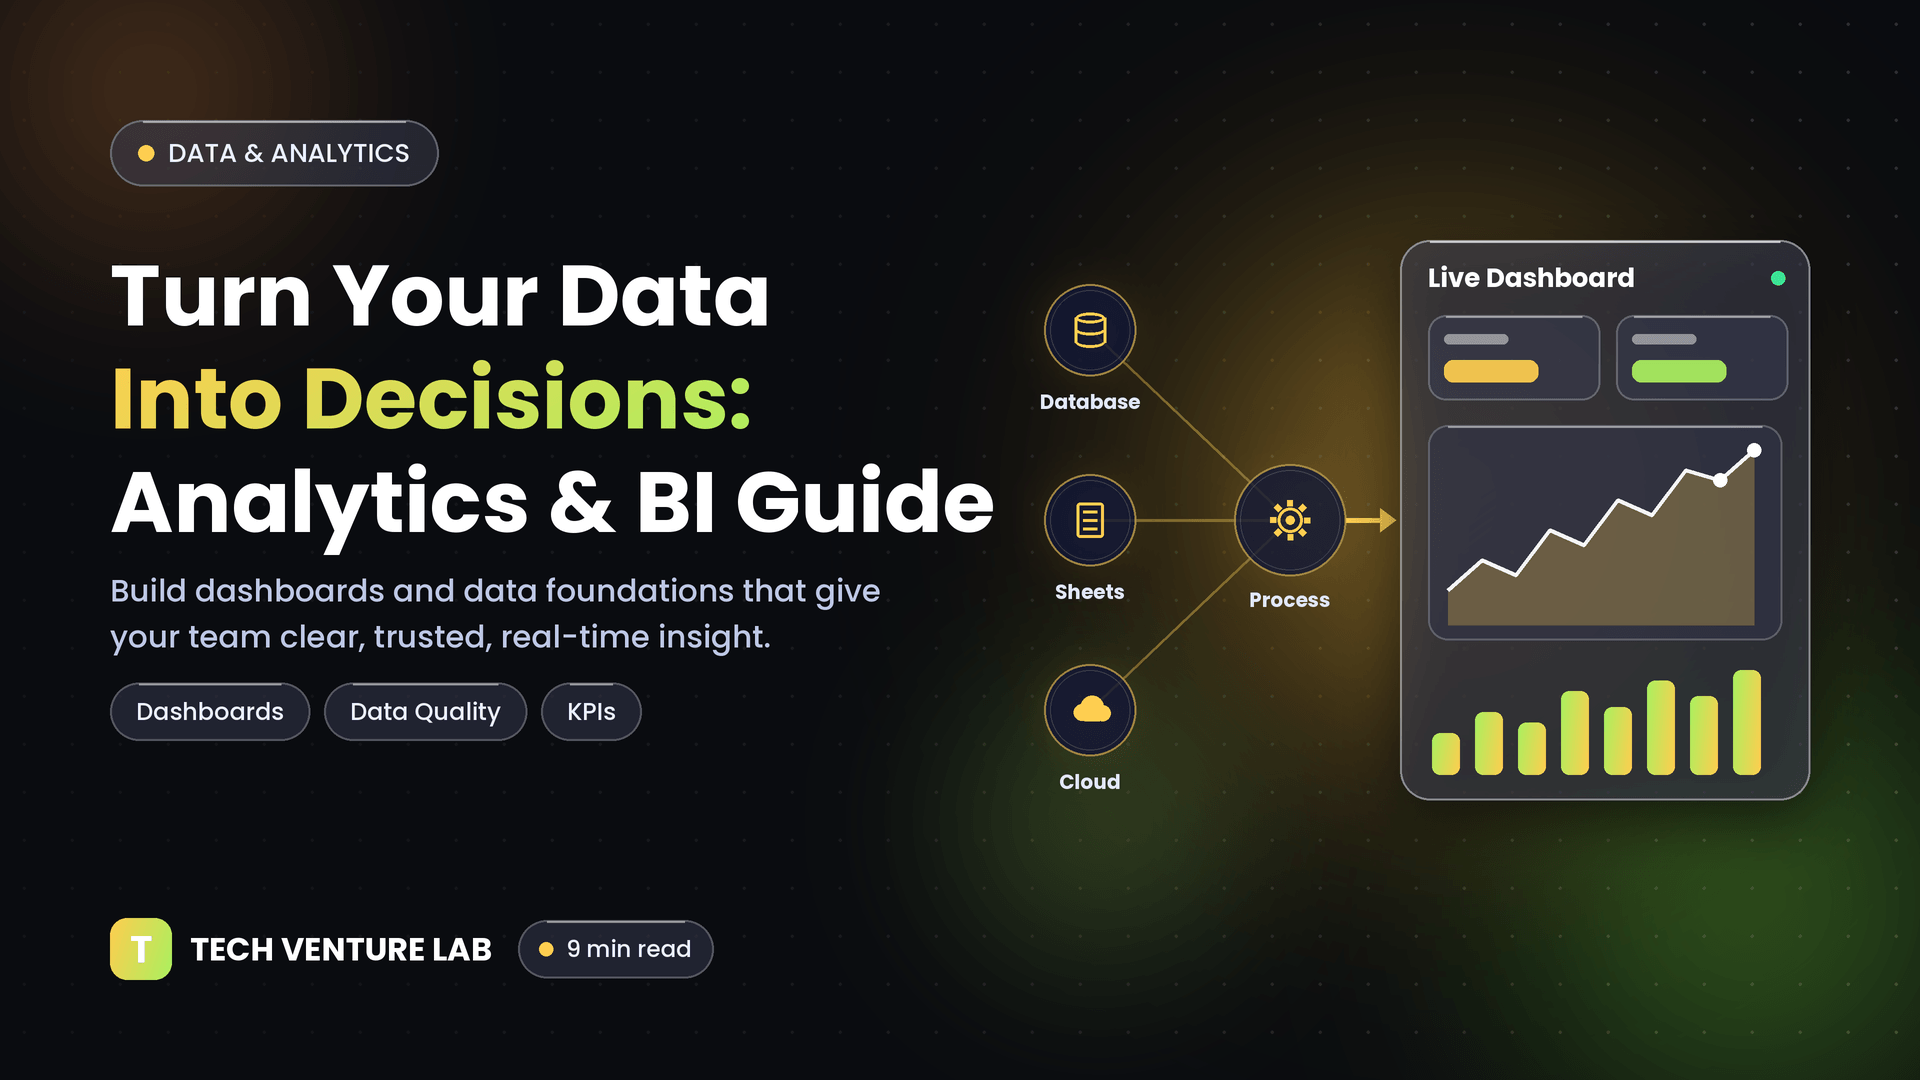
Data analytics and business intelligence (BI) turn raw data into answers. This guide explains the concepts, the building blocks and a practical path to becoming truly data-driven.
The two are closely related, and often used together:
| Level | Question | Example |
|---|---|---|
| Descriptive | What happened? | Monthly sales by region |
| Diagnostic | Why did it happen? | Why sales dropped in one region |
| Predictive | What is likely to happen? | Forecast next quarter's demand |
| Prescriptive | What should we do? | Recommended stock levels and pricing |
Most businesses start with descriptive and diagnostic analytics, then move toward predictive and prescriptive as their data foundation matures.
Where your data originates: your application database, CRM, accounting software, e-commerce platform, marketing tools, spreadsheets, payment systems, website analytics and IoT or device data.
Processes that collect data from different sources, clean it and move it to a central place. This is often called ETL or ELT (extract, transform, load). Automated pipelines keep your data fresh and reduce manual work.
A central location where data is organized for analysis:
Turning raw data into reliable business concepts such as "customer", "order" and "revenue", with consistent definitions. This step creates a single source of truth.
BI tools and dashboards that let people explore data, build charts and track KPIs. Popular tools include Power BI, Tableau, Looker Studio, Metabase and custom dashboards built into your own application.
Rules for data quality, access control, privacy and compliance. Not everyone should see everything, and sensitive data must be protected.
A dashboard should help someone make a decision in seconds. Good dashboards:
Avoid decorative complexity. If users cannot tell what to do after viewing it, the dashboard is not working.
| Department | Example KPIs |
|---|---|
| Sales | Revenue, conversion rate, average deal size, pipeline value |
| Marketing | Cost per lead, customer acquisition cost, campaign ROI, traffic sources |
| Customer Success | Retention, churn rate, satisfaction score, support resolution time |
| Finance | Gross margin, cash flow, outstanding receivables, burn rate |
| Operations | Order fulfilment time, inventory turnover, defect rate |
| Product | Active users, feature adoption, activation rate, time to value |
Choose KPIs that connect directly to your business goals, and define each precisely so everyone calculates them the same way.
Start with decisions, not tools. List the questions your leaders and teams need answered regularly.
Find where the relevant data lives, who owns it and how reliable it is. Note gaps, duplicates and inconsistencies.
Pick one high-value area, such as sales performance or customer retention, and deliver a useful dashboard quickly. Early wins build support.
Automate data collection and cleaning so reports no longer depend on manual spreadsheet work.
Agree on definitions for key terms such as "active customer" and "revenue". Document them.
Build for the audience, gather feedback and refine. Train people to use the data in meetings and decisions.
Add more data sources and departments, then explore predictive analytics, anomaly detection and AI-driven insights.
Ready-made BI tools are quick to adopt and work well for many reporting needs. Custom analytics makes sense when you want dashboards embedded inside your own product, need specialized calculations or integrations, or require tight control over security and user experience. Many companies start with standard tools and add custom components as their needs grow.
At Tech Venture Lab, we build data-driven digital products: from integrations and data pipelines to custom dashboards, reporting systems and AI-powered insights. We help you connect your data, trust your numbers and give your team the clarity to act.
Ready to make better decisions with your data? Contact us to plan your first dashboard.
Becoming data-driven is not about collecting more data; it is about asking the right questions, building trusted foundations and putting insights in front of the people who make decisions. Start small, prove value quickly, and grow your analytics capability step by step.